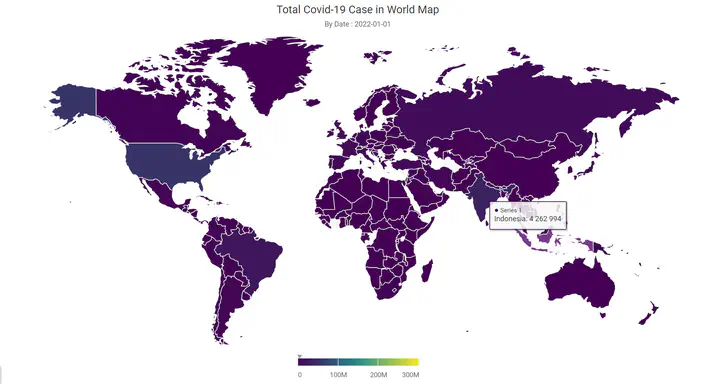
Untuk membuat map penyebaran data, terlebih dahulu memanggil packages yang dibutuhkan
# Instal packages

library(tidyverse)
## ── Attaching core tidyverse packages ──────────────────────── tidyverse 2.0.0 ──
## ✔ dplyr     1.1.3     ✔ readr     2.1.4
## ✔ forcats   1.0.0     ✔ stringr   1.5.0
## ✔ ggplot2   3.4.4     ✔ tibble    3.2.1
## ✔ lubridate 1.9.3     ✔ tidyr     1.3.0
## ✔ purrr     1.0.2
## ── Conflicts ────────────────────────────────────────── tidyverse_conflicts() ──
## ✖ dplyr::filter() masks stats::filter()
## ✖ dplyr::lag()    masks stats::lag()
## ℹ Use the conflicted package (<http://conflicted.r-lib.org/>) to force all conflicts to become errors
library(highcharter)
## Registered S3 method overwritten by 'quantmod':
##   method            from
##   as.zoo.data.frame zoo
## Highcharts (www.highcharts.com) is a Highsoft software product which is
## not free for commercial and Governmental use
library(widgetframe)
## Loading required package: htmlwidgets
Selanjutnya import data covid dan saya menampilkannya menggunakan head() sehingga hanya menampilkan 6 baris pertama saja
total_case <- read.csv("covid_data.csv")

head(total_case)
##   X       location total_cases
## 1 1    Afghanistan      158059
## 2 2         Africa     9904945
## 3 3        Albania      209516
## 4 4        Algeria      218432
## 5 5 American Samoa          11
## 6 6        Andorra       23740
Setelah packages dan data sudah siap selanjutnya kita akan membuat visualisasi mapsnya
map <- highchart() %>%
  hc_add_series_map(worldgeojson, total_case,
                    value = "total_cases",
                    joinBy = c('name','location'),borderColor = "#FAFAFA") %>%
  hc_add_theme(hc_theme_ffx()) %>%
  hc_colors(c("darkgreen", "darkred")) %>%
  hc_colorAxis(stops = color_stops()) %>%
  hc_title(text = "Map Penyebaran Covid-19") %>%
  hc_subtitle(text = "Tanggal Data : 2022-01-01") %>%
  hc_credits(enabled = T, text = "Made by Harun Deppalallo")

frameWidget(map)